Overview and Strategy
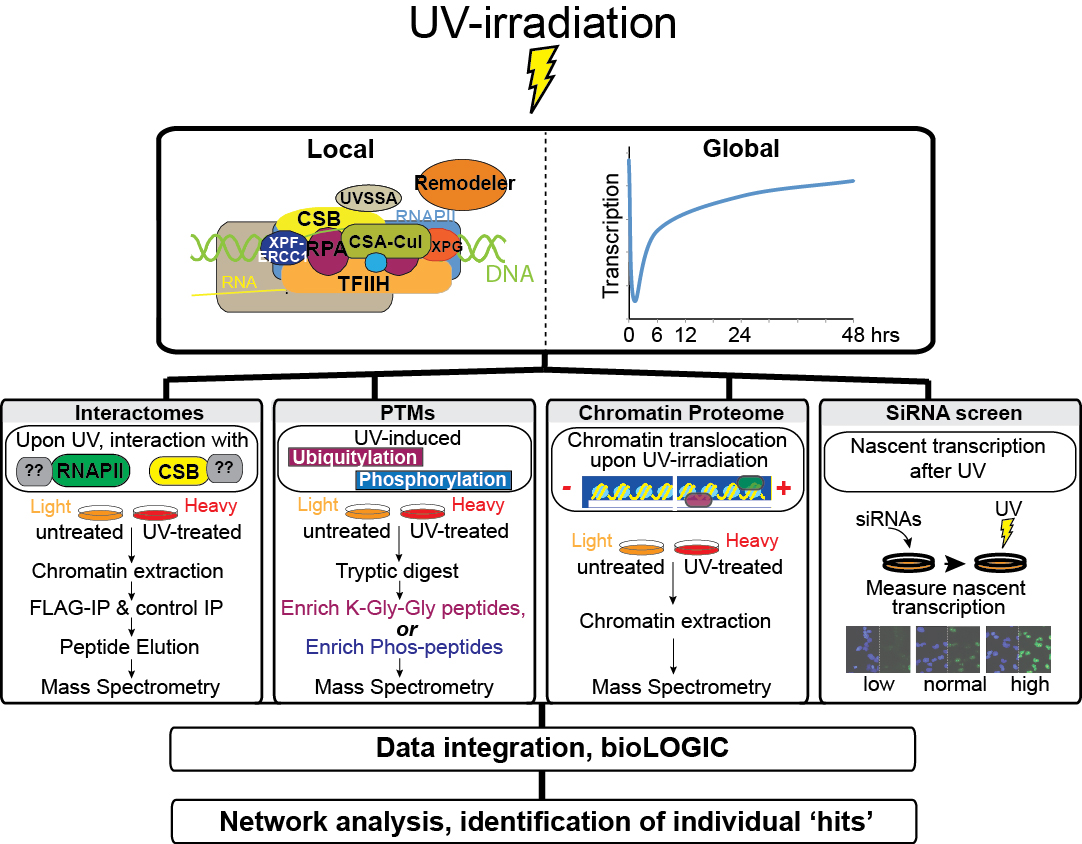
UV-induced DNA damage has effects both at the local (‘repairosome’) and the global level. The proteomic screens and the siRNA screen used to investigate the damage response are outlined. 30 J/m2 UV-irradiation was used for all proteomic analysis, while 15 J/m2 was used in the RNAi screen
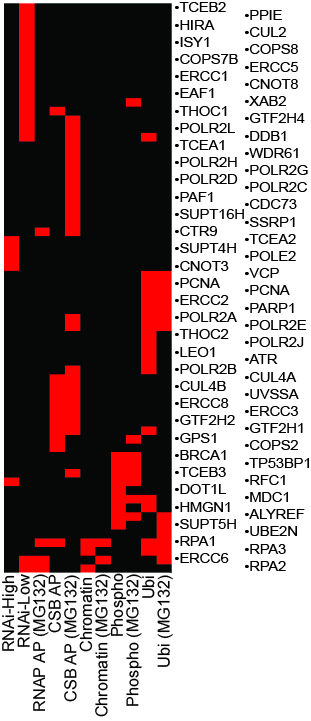
CSB/ERCC6-Proteomics
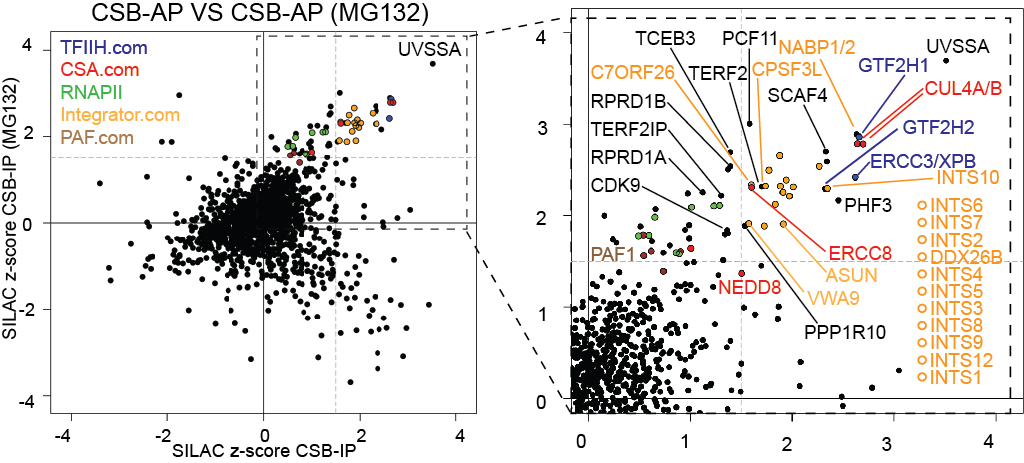
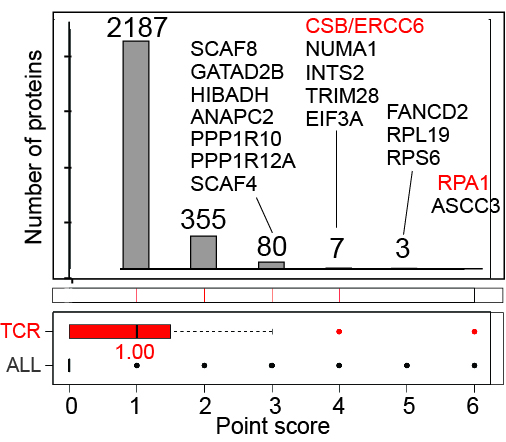
Effect of UV-induced DNA damage on the CSB/ERCC6 interactomes:
Left, the UV-induced CSB interactome, in the presence and absence of MG132 as indicated.
Middle, enlargement of section indicated by box on the left.
For clarity, only a few interesting proteins are indicated. Integrator subunits are labeled in yellow.
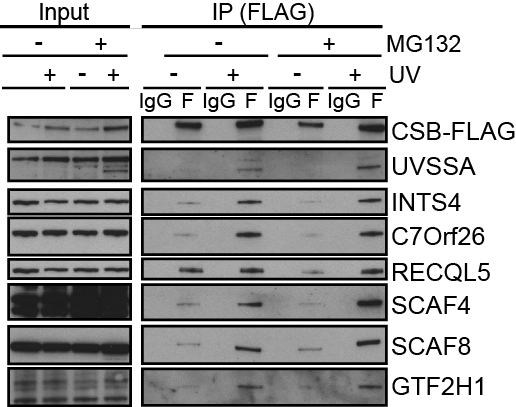
(Right) Western blots of ERCC6/CSB-Flag immuno-precipitation. Note that CSB does not seem to enrich a specific, phosphorylated form of RNAPII (left panel).
Experimental Details:
ERCC6/CSB was immunoprecipitaed from chromatin fractions prepared from untreated and UV-treated cells, respectively. After peptide elution, the eluates were mixed in a 1:1 ratio and subjected to mass spectrometry.
RNA Polymerase II (RNAPII) Proteomics
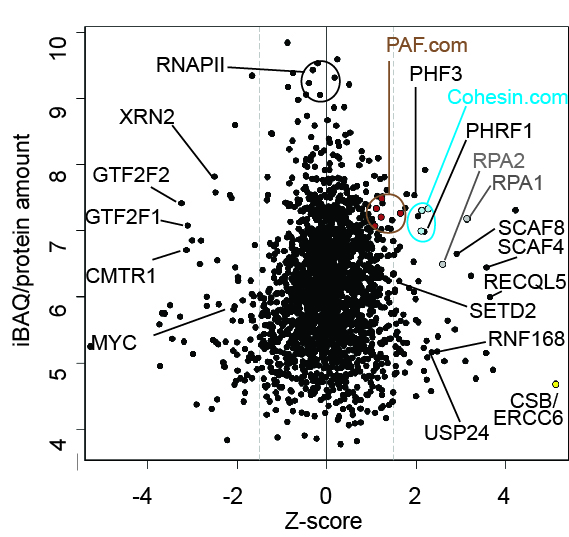
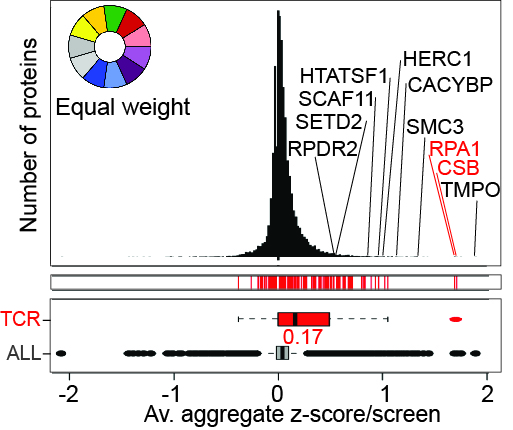
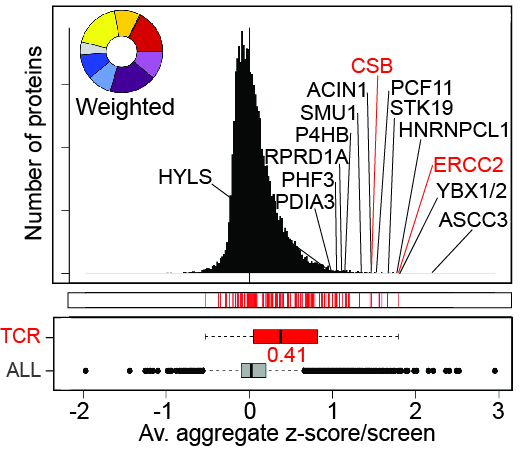
Effect of UV-induced DNA damage on RNA Polymerase II (RNAPII) Interactomes.
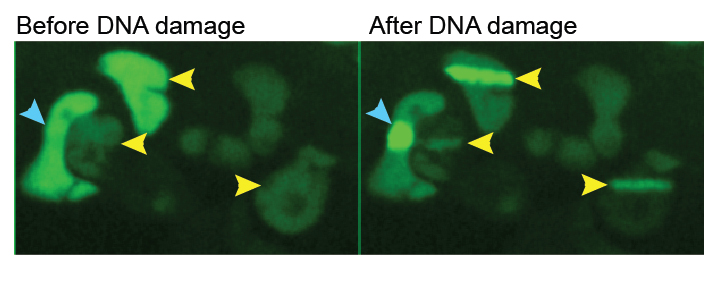
ERCC6/CSB is recruited to RNAPII upon UV-irradiation in chromatin.
Experimental details:
RNA polymerase II (RNAPII) was immunoprecipitaed from chromatin fractions prepared from untreated and UV-treated cells, respectively. Due to the rapid RNAPII degradation of RNAPII upon UV-irradiation, the proteasome inhibitor MG132 was present in both situations. After peptide elution, the eluates were mixed in
a 1:1 ratio and subjected to mass spectrometry.
Chromatin Translocation
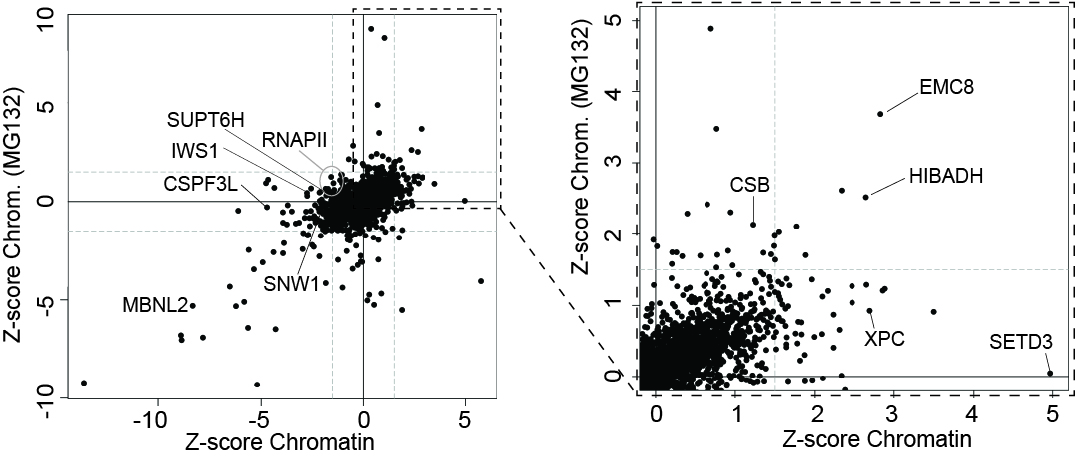
Left, the effect of UV-irradiation on the chromatin proteome in the presence and absence of MG132, as indicated. Right, enlargement of section indicated by box on the left. A few proteins are indicated.
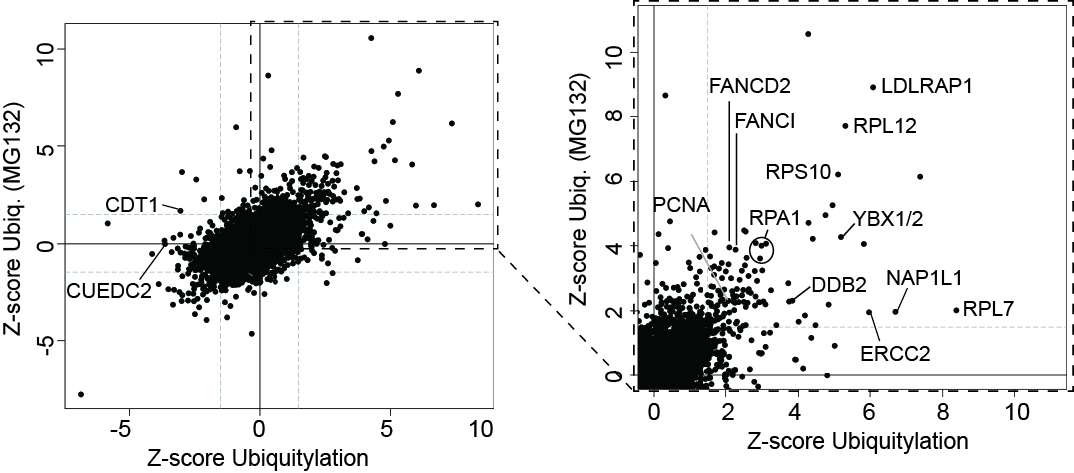
UV-induced Ubiquitylation Changes
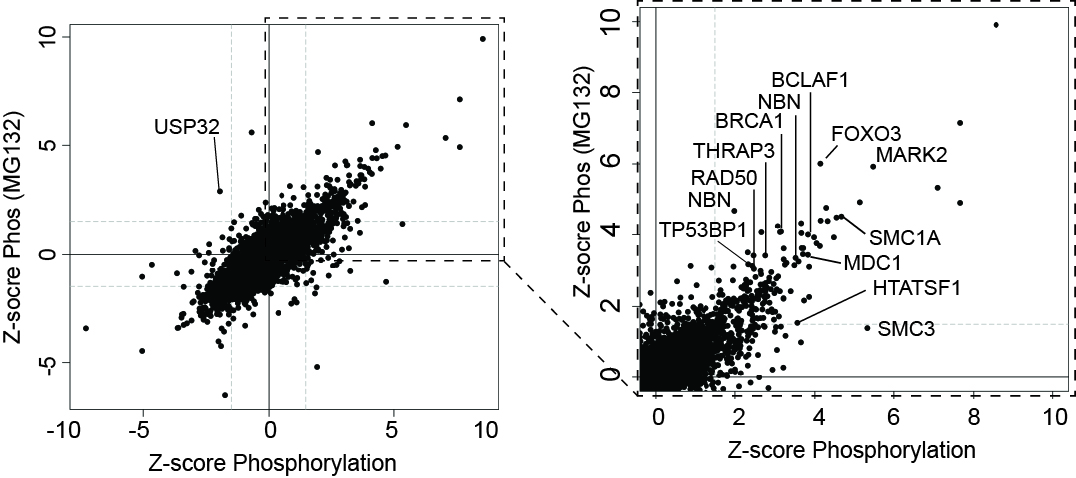
Left, the effect of UV-irradiation on phosphorylation in the presence and absence of MG132, as indicated. Right, enlargement of section indicated by box on the left. A few proteins are indicated.
UV-induced Phosphorylation Changes
Left, the effect of UV-irradiation on ubiquitylation in the presence and absence of MG132, as indicated. Right, enlargement of section indicated by box on the left. A few proteins are indicated.
RNAi Screen for Transcription-recovery after UV DNA-damage
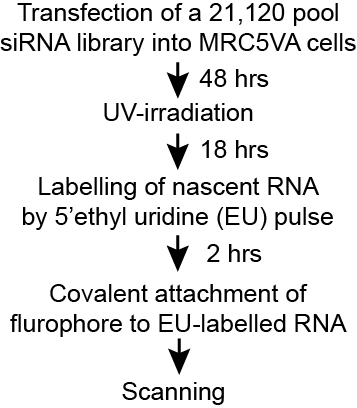
Top left: The experimental approach.
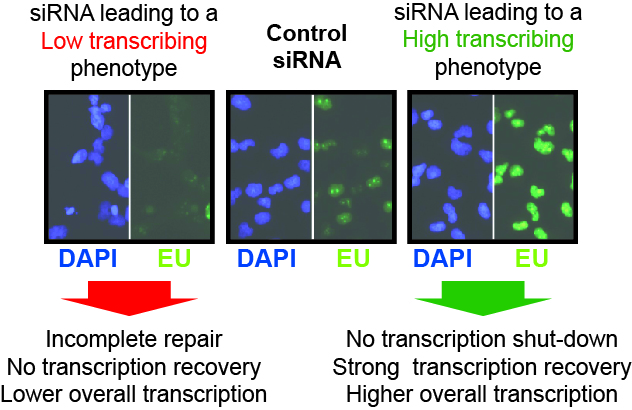
Top middle: Typical examples of siRNAs that result in either (left) ‘low transcription’, or (right) ‘high transcription, relative to the controls (middle).
Different putative causes (not necessarily mutually exclusive) of the outcome are listed below arrows.
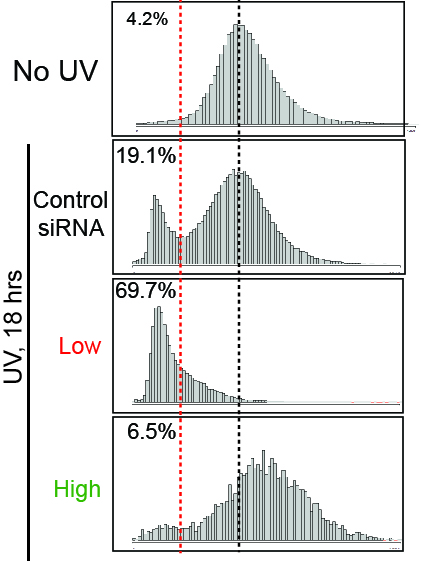
Top right: Nascent transcription profiles across a cell population in the absence of
UV-irradiation, and in the examples from (top middle), used to identify siRNAs giving rise to low and high transcription, respectively. EU intensity (Y-axis) across the population of cells in an individual plate well (X-axis) is shown.
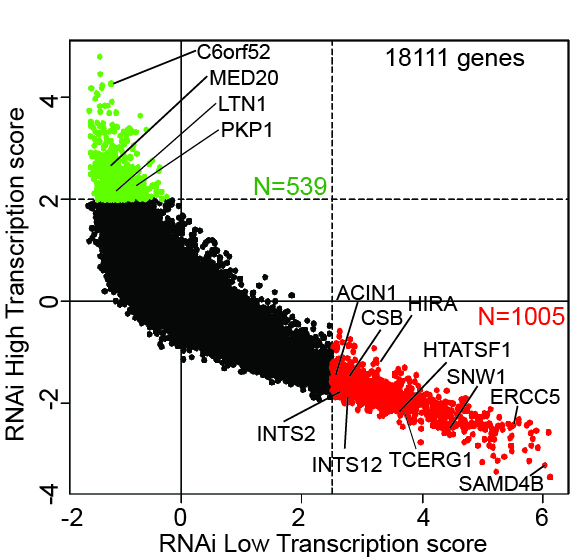
Bottom: Graphical representation of the screen result. High transcribers are labeled green, and low transcribers are red. Specific genes are indicated. Other proteins can be searched at http://www.biologic-db.org.
Data Integration I - Kinases
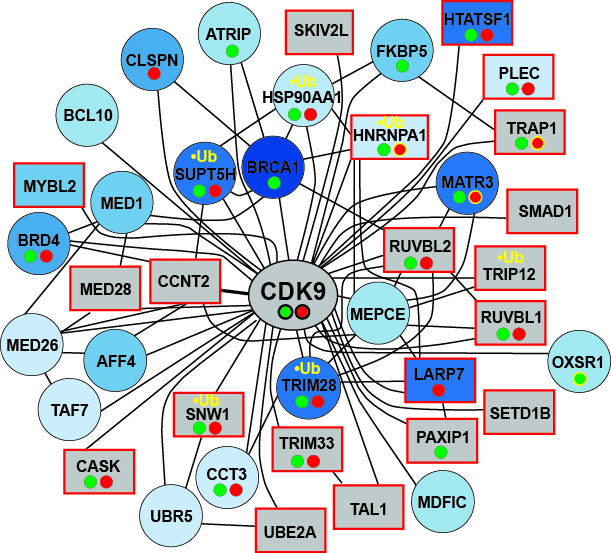
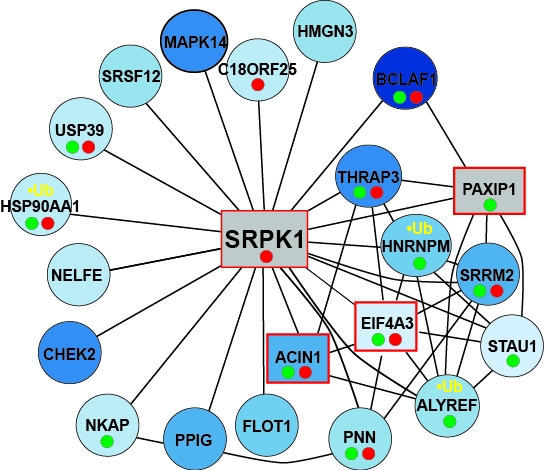
Left Panel: Proteins that interact with CDK9 (pTEFb) and which become phosphorylated upon UV-irradiation. Proteins are labeled increasingly blue with
increasing phosphorylation. Proteins that scored in the RNAi screen, (squares with red border), interacted with RNAPII (small green spheres under name),
interacted with CSB (red spheres), or became ubiquitylated upon UV-irradiation (yellow ‘•Ub’) are indicated.
Examples of CSB- or RNAPII-interactions that increased (black circle around spheres) or decreased (yellow circle around spheres) upon UV-irradiation
are also specified.
Right Panel: As in the right panel, but for proteins that interact with SRPK1.